

Here’s a Medium-Risk, Very-High-Reward Trade
I hope you understand that, “Terrorism, Money Printing, High Gold Prices and Political Controversies,” normally make the market crash, or at least retreat.
However, that’s not what happened. The market actually reached record highs.
Most people have been glued to the TV watching the terrorist attacks in France and Germany, and watching the Trump/Hillary debacle. That’s not to mention the repercussions that Brexit is still creating, the impending Italian banking crisis, and the ever escalating China situation.
I think we can all agree that there hasn’t been ‘encouraging’ news on any of these fronts.
Meanwhile, the market marches higher… and the VIX (the fear gauge) dips lower. More people are buying up the stock market, while less people are nervous about the future.
Well, at least that seems encouraging.
BloombergMarkets writes that, “the VIX seems low considering the macro risks on the horizon.”
I’d definitely agree with that.
Take a look at VXX: 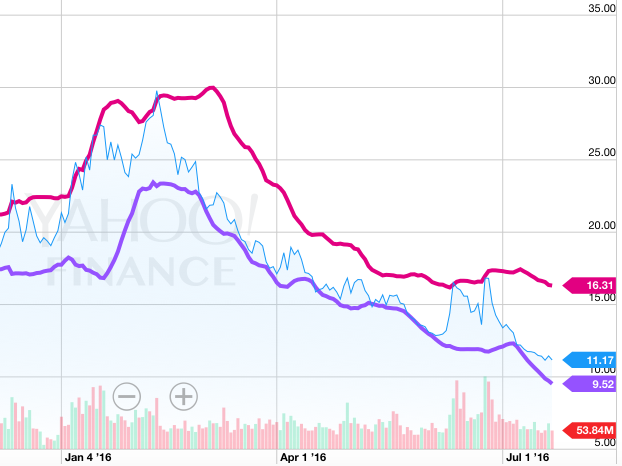 The pink and purple lines are Bollinger Bands, which give us clues as to when the VXX is going to reverse course, normally when it hits the upper or lower band. It’s been in a free-fall since Brexit (which, admittedly, is only a month).
The interesting thing to me is that events that are actually much more impactful to the US market (like the Presidential election) haven’t spooked anyone.
Here is the historical chart of the VIX index: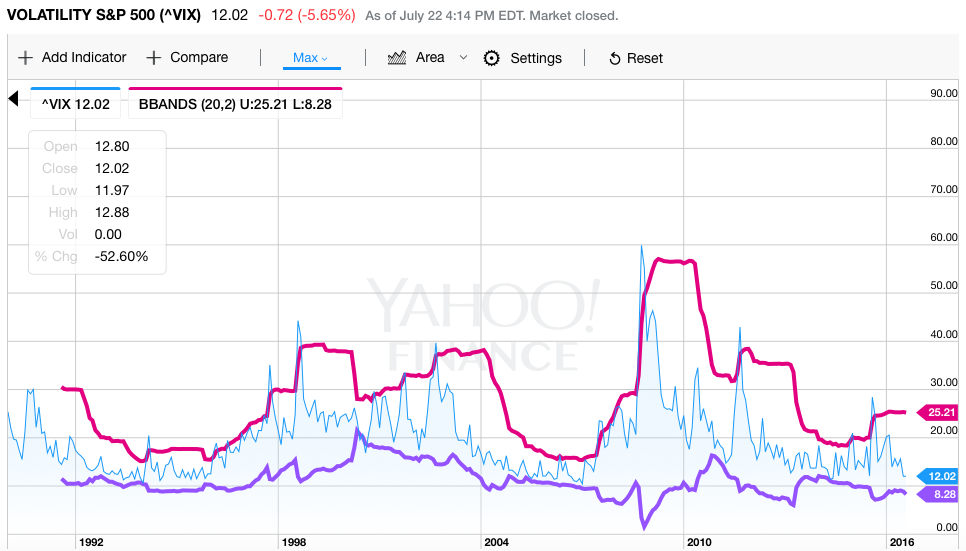 The last ‘big’ spike we had was last August when China’s meltdown bled into the US. The largest ever spike was in ’08, when the index touched 60.
BloombergMarkets continues in the same article that, “If these risks fail to materialize and the market continues to experience low volatility, then the VIX spot will stay low…”
This, of course, is a real possible risk. The possibility, or rather the probability, that the market continues to experience no fear is very likely.
This sentiment is also built into options pricing.
Let’s look at a couple trades that we can do with that in mind…
The current price of the July 29th $14.50 call option is at $.03. (This, by the way, may change today, as I wrote this on July 24th).
Using this awesome options profit calculator we can buy 100 contracts for $300.
Here is our profit table: 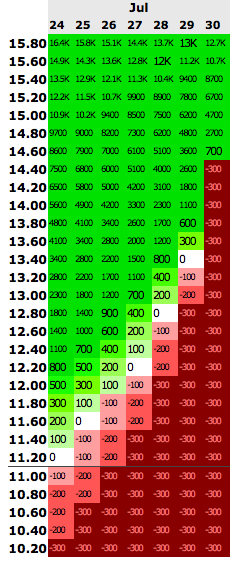 More risk, than I’d like, as the contract expires rather quickly. Although a quick spike in the index could prove very profitable.
The August 5th $18 call option is trading at .03 cents also.
And I could continue up the scale, with other contracts, all sub $20.
Ok… I’m sure I have lost you by now…. but if you managed to at least read this far, I did a little extra work on my own just for you.
I figured out the average August 1st price of the ^VIX since 1990. That’s 26 years of data, if you’re not a math whiz.
So, what’s that average?
It’s 20.
What’s it at right now? 12.
To sum up why I believe this is an interesting, and possibly worthwhile trade, here are the main points:
1. The average August price (going back 26 years) is nearly double what the VIX index is at right now.
2. There are nearly weekly worldwide events that have significant impact on the the public sentiment of our markets.
3. The presidential campaign is heating up, with more people getting angrier and frustrated on each side. This usually results in fear in the economy.
4. Our markets have been continually going up because of massive foreign inflows and from unrealistic pricing by consumers. Of course, this trend could continue for much longer (that is how bubbles form), but eventually they will end in a big bang – which is a spike in the VIX.
5. The risk/reward situation seems to be very attractive right now. Call options don’t seem to be properly priced for the risk that is currently in the market. We could buy an option for each of the several contract dates within the year, and lose a maximum of about $1,000 (with the assumption that each contract is only a couple hundred bucks). The upside could be enormous. Here is another chart with a farther out contract date and $400 spent. We have a downside of $400 and realistic upside of $20k+, with the assumption that the VIX returns to it’s 26 year average (if we have an ’08 experience this year, you’d be pushing on $500k+ from that same contract):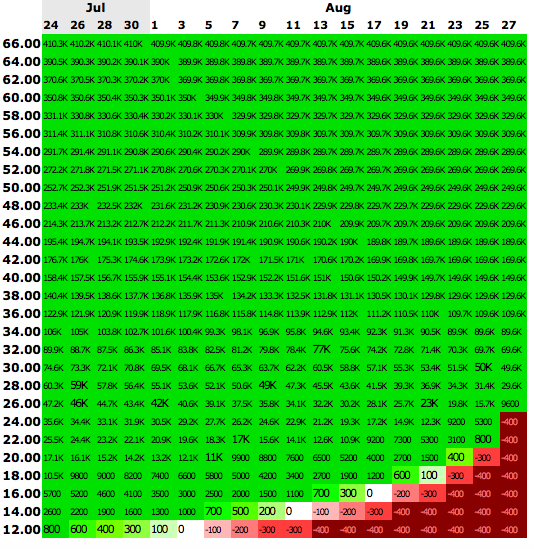 All of that said, this is an extremely risky trade and past performances don’t necessarily guarantee success.
In fact, the economic environment we are currently in (with low interest rates) is completely foreign territory for the world. So we could end up seeing completely unexpected events.
***As a disclosure, I currently do not have any trades based on this concept open. I also am not going to open a trade with the exact information above, as I believe the market conditions will change drastically in the coming weeks (in regards to this trade and how VIX options are priced). The risk/reward is definitely attractive, but keeping track of this situation will also give us better insight to the direction we are headed on a more macro scale.